


The Home Depot
Founded in 1978, The Home Depot is the world’s largest home improvement retailer with over 2,300 stores in North America and $159.5 billion in gross revenue in 2024. Serving the unique needs of over 14 million households is a daunting task, so in 2023 The Home Depot stood up a program team focused on Personalization.
Strategy
The Personalization program at The Home Depot was built on the foundation of 3 customer-centric values:
Know me: Have quality data about me and my past interactions with The Home Depot to provide timely and accurate content based on my behavior and preferences and anticipate my needs to help me with what I need next
Meet me: Provide me a frictionless experience on my preferred channels and maintain a personalized experience regardless of how I choose to engage with The Home Depot
Speak to and value me: Provide relevant products, content, and offers that inspire me, based on what you know about me
To meet these values, we planned our work across the enterprise in 6 key cross-channel strategies:
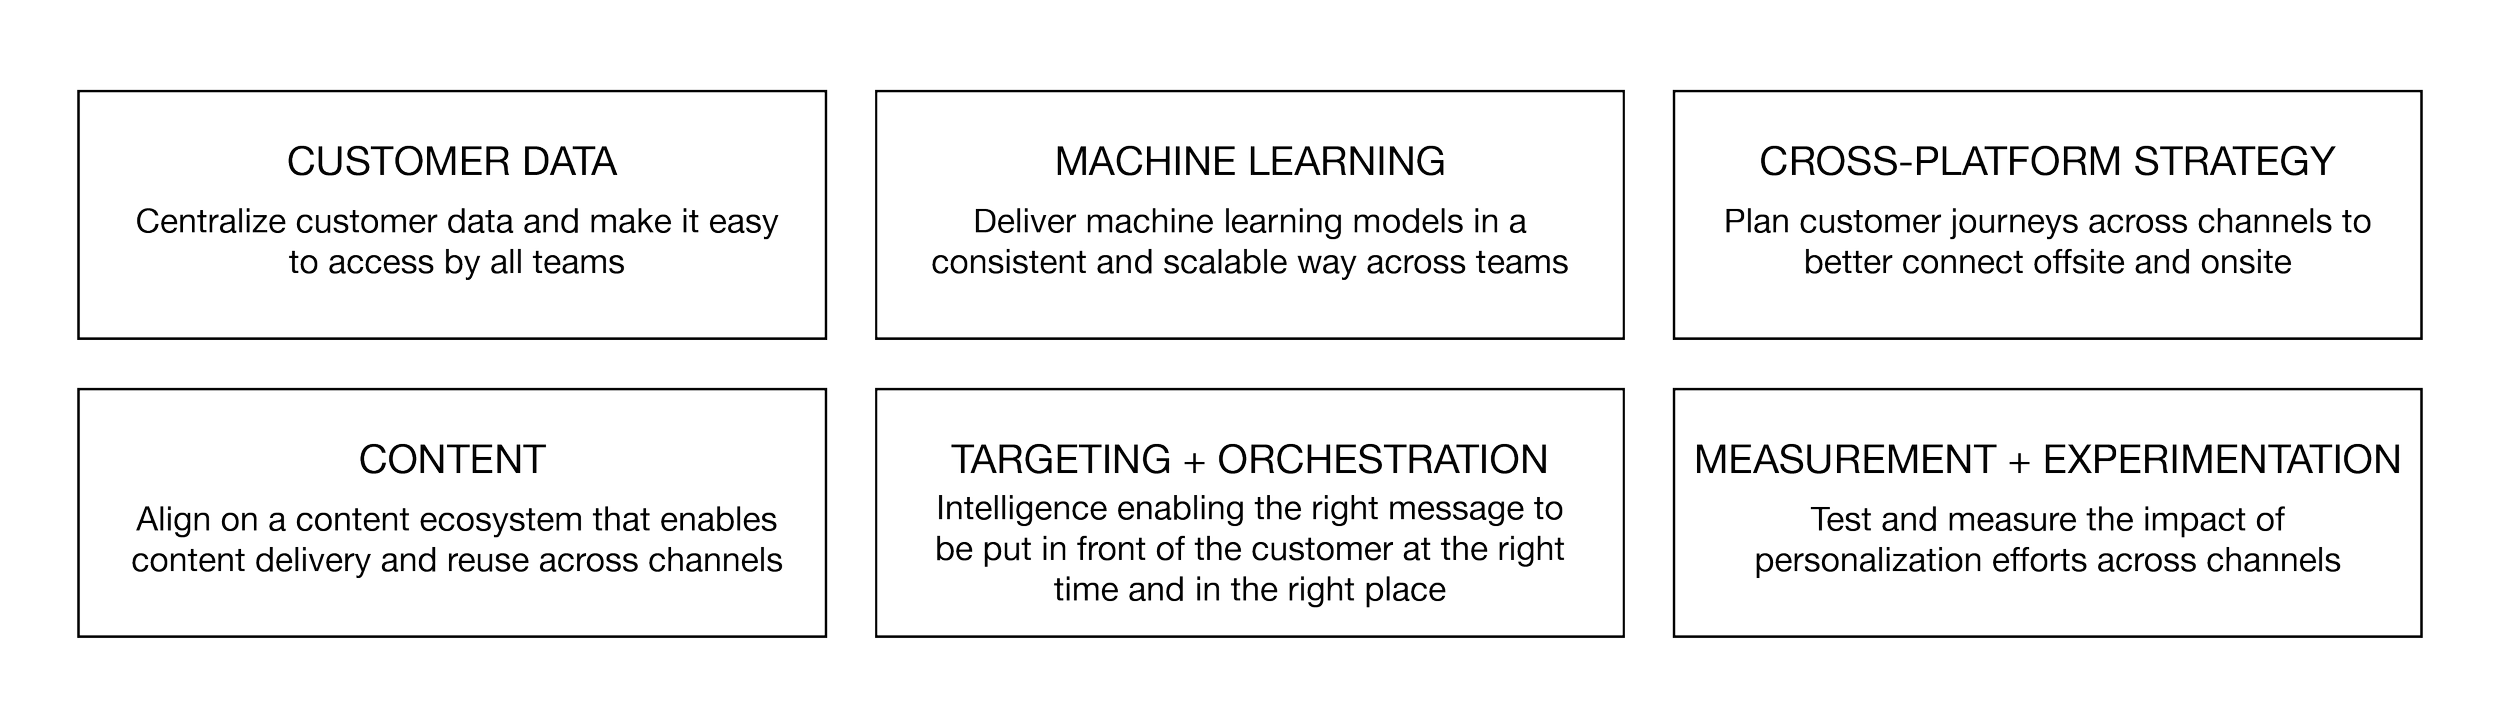
Online and Marketing organizations at The Home Depot operate very separately, and my team and I quickly realized that we would have to lead alignment on some foundational technology and processes that were needed to be able to coordinate between these two parts of the business:
Customer Data
When we started our efforts in early 2024, ~70% of our customer data was stored outside of our enterprise data warehouse. My team began to address this by leading an evaluation to identify an enterprise-wide CDP. In partnership with my Principal Product Manager, we developed a scorecard to proceed with an evaluation of internal tools and external vendors.
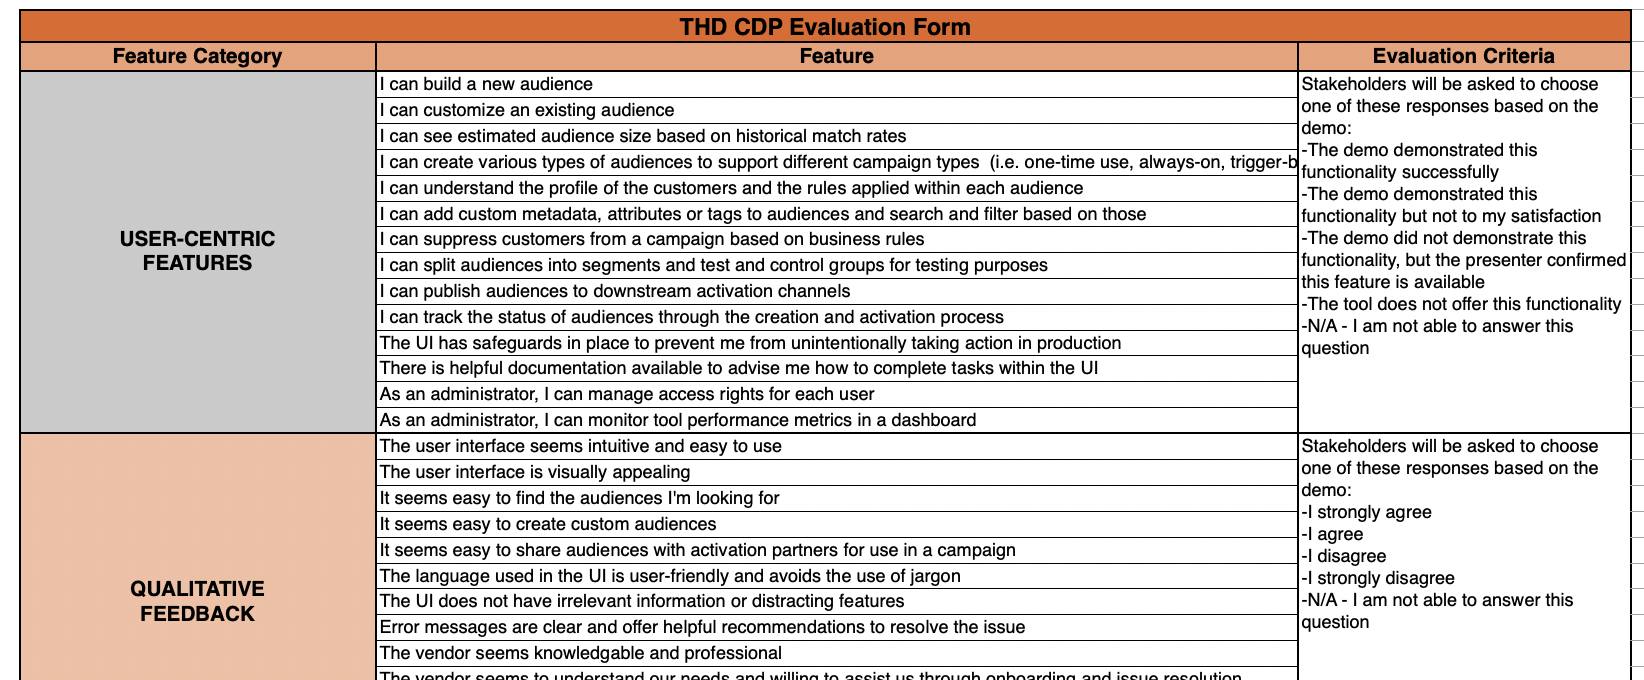
We proceeded with the evaluation, incorporating 40-50 stakeholders across the company who represented different disciplines and areas of the business. Then we presented the results of the scorecards to a steerco of VPs, SVPs, and EVPs who ultimately made the selection.
Another area that required alignment was around our collection and use of zero party data. My business stakeholders and I surveyed 20+ teams across the company to identify where we were already sourcing information directly from clients. This spanned everything from persistent data like name, address, or trade to transient data related to what projects they were working on.
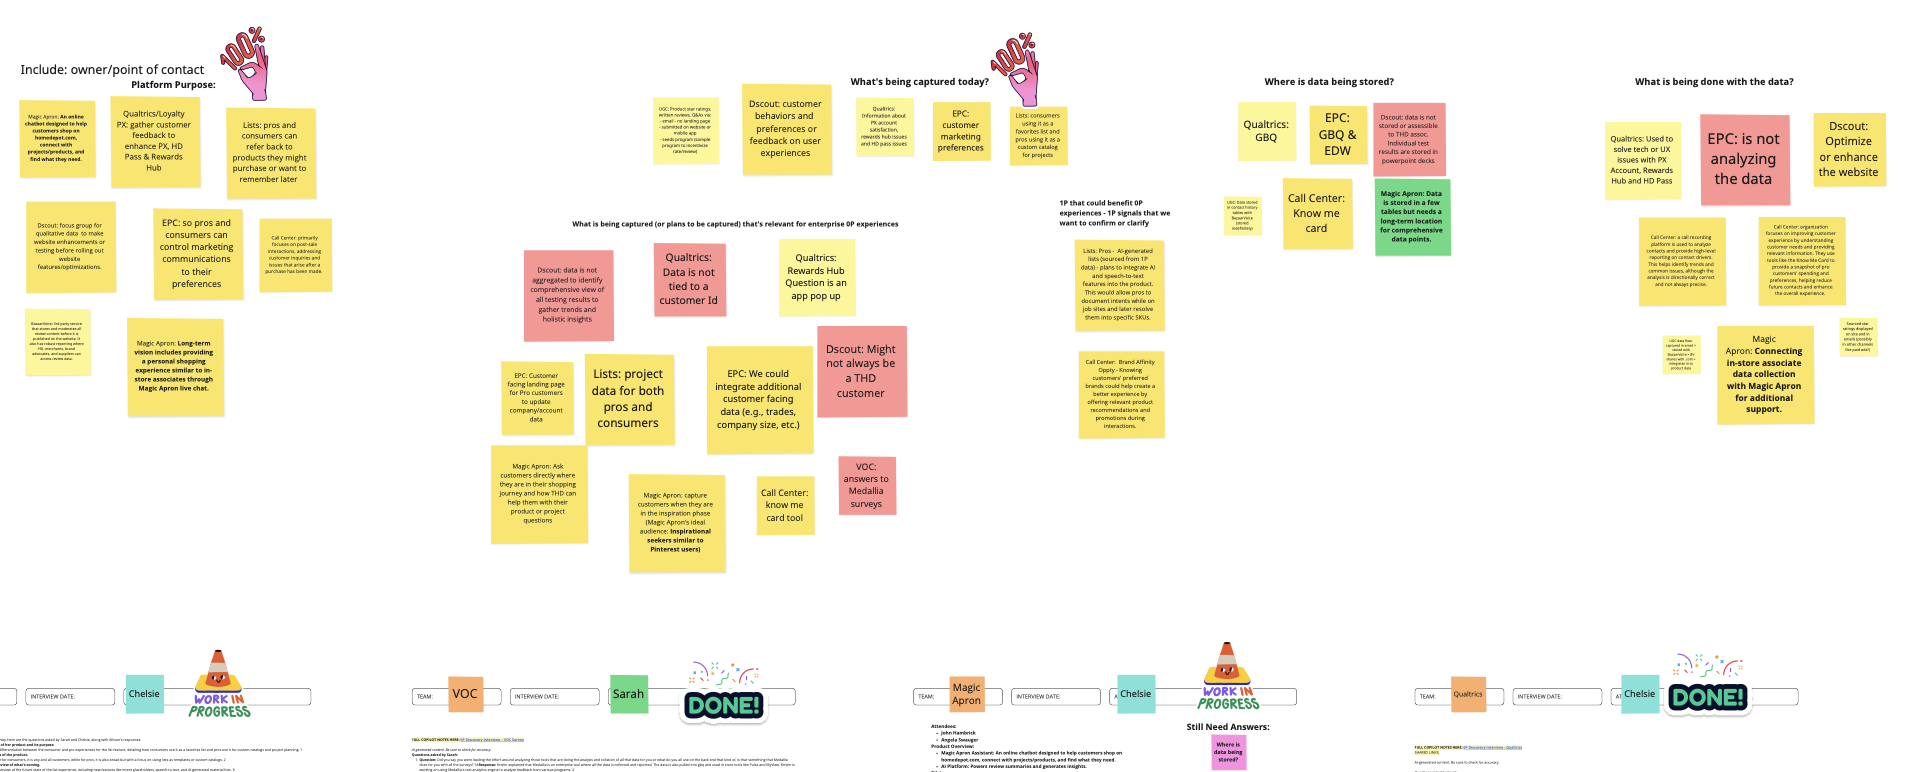
We engaged IT and customer data teams to identify a path forward of where to store and centralize all of this data so that different teams could access it and we weren’t duplicating efforts across the enterprise or repeatedly asking our customers the same questions.
Once established, we were able to launch new campaigns to fill in profiles on our customers or re-engage lapsed customers to simply understand, what are you working on?
Decisioning & Intelligence
Historically marketing and online have had their own siloed data science teams who were creating models that only served and took into account a customer’s interactions on those separate channels. Our team drove the centralization of these models so that we could take into account customer actions across any channel (online, in store, and in marketing campaigns), level set on the model methodology, and consolidate duplicate models.
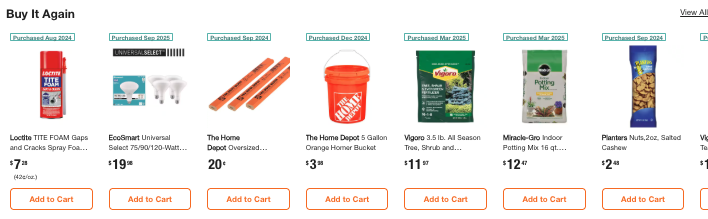
One example is the data and models powering our “buy it again” product recommendations. Previously this module on our website only included purchases that were made online, which made for a very disjointed customer experience. After pushing our partners to include in store purchases in this model, it not only created a more cohesive experience, but has also driven nearly $6 million in incremental revenue (April-September 2025) and increased gross demand for the buy it again model by $900k+ per week.
Working with our Data Science Principal, we also identified another key opportunity was that we needed to coordinate our separate models, which would dramatically increase their joint effectiveness, leading to a much more cohesive customer experience and a significant lift in overall conversion and engagement. The foundation of this model orchestration was first convincing the data science teams to incorporate customer embeddings.
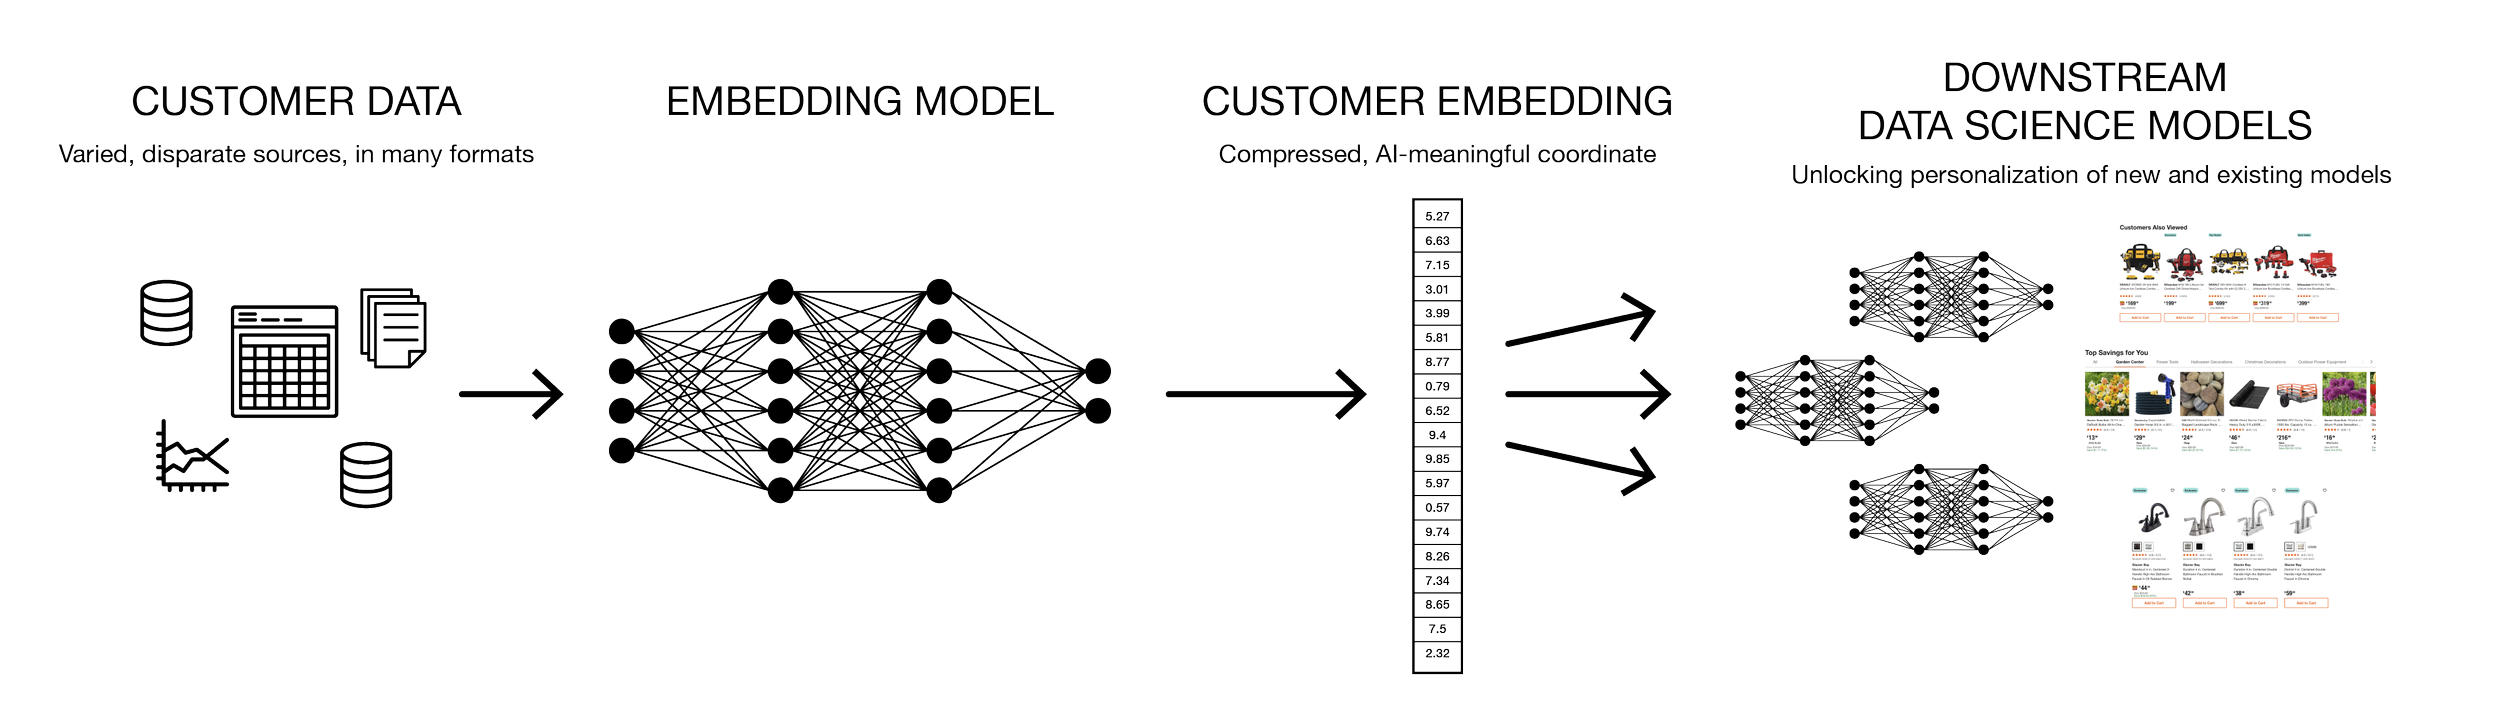
Our data science models drive $3B gross demand annually across search, recommendations, marketing, customer support, and more. Historically our models have drawn on customer data that’s in many, disparate sources and formats, these models were duplicative across teams, costly to maintain, and difficult to utilize.
Moving to use customer embeddings would unlock increased productivity of our models and our teams, and it would enable true personalization in our models to provide more relevant products or recommendations.
Experimentation & Measurement
Measuring the effectiveness of personalization is a difficult task. Our initial recommendation to leadership was to identify a program control holdout which would help us quantify the impact of Personalization on engagement and sales.
Group Size: 0.75% of total marketing eligible households (~810K households)
Duration: Households will be part of the Control Group for 6 months. New households will be identified and refreshed after 6 months to prevent long-term impacts on customer loyalty
After months of discussion, the program level holdout was deemed too risky by our cross-channel VPs. So my team offered options for a custom hold out group that was comprised of representative customers from our broader eligible population:
Group make up: 810K HH who are specifically chosen to match larger Home Depot population
Pros/Cons: More effort for teams to suppress this group but is more scientifically sound approach with the least amount of households impacted
Ultimately leaders chose to align on only marketing campaign level hold outs which has limited our ability to measure the true impact of things like our data science models which power so much of the always-on customer experience on our website.
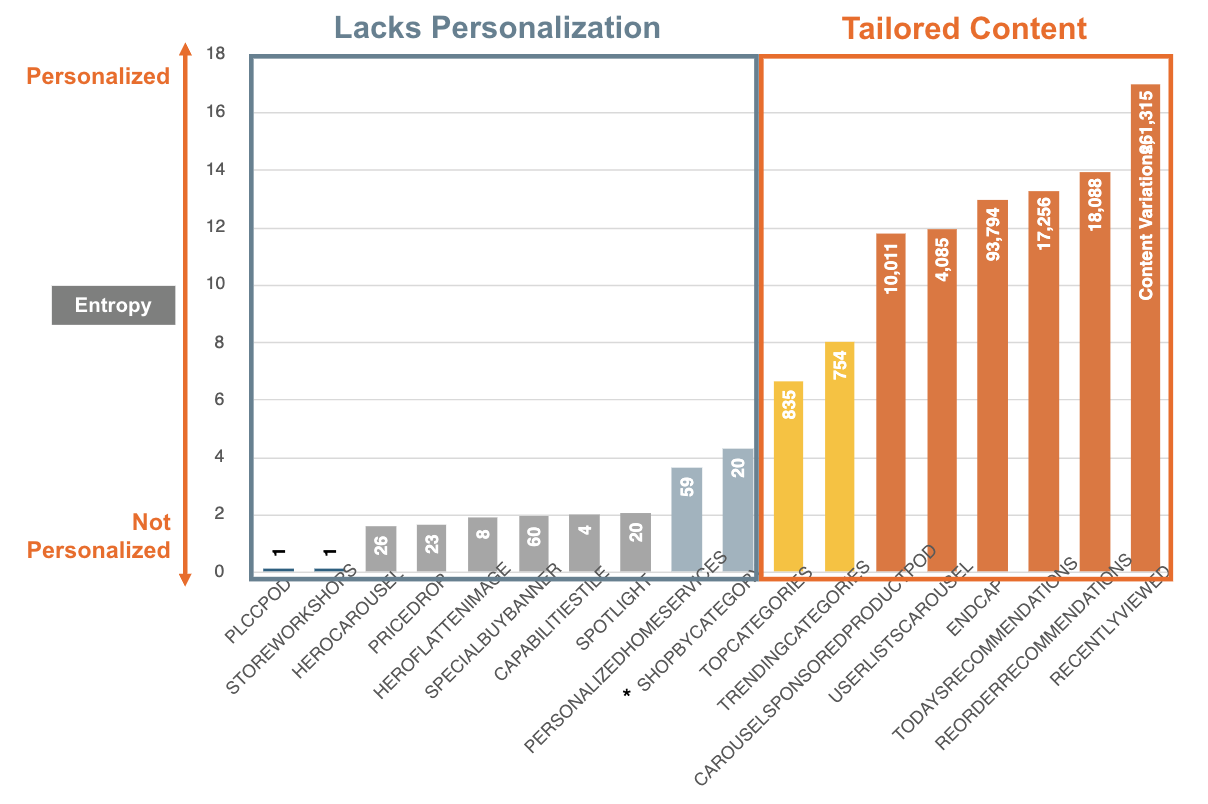
Because we were ultimately directed to measure the revenue impact of campaigns, my team also wanted another method of measuring customer engagement so we worked with data science partners to be able to measure always-on personalization. Our measurement team partners came back with a method focused on measuring entropy. We measured the number of variations that were being presented in a given site module - the higher the entropy (the higher degree of variations/disorder/randomness), the higher the personalization in that module.
Cross-Channel Strategy
~40% of all traffic on The Home Depot website is driven there from a marketing channel with entry pages seeing an almost 50% bounce rate. I ran continuous discovery sessions throughout 2025 with 15+ teams in marketing and online to identify key opportunities where we could improve the connection between the off site marketing driver and the on site landing page.
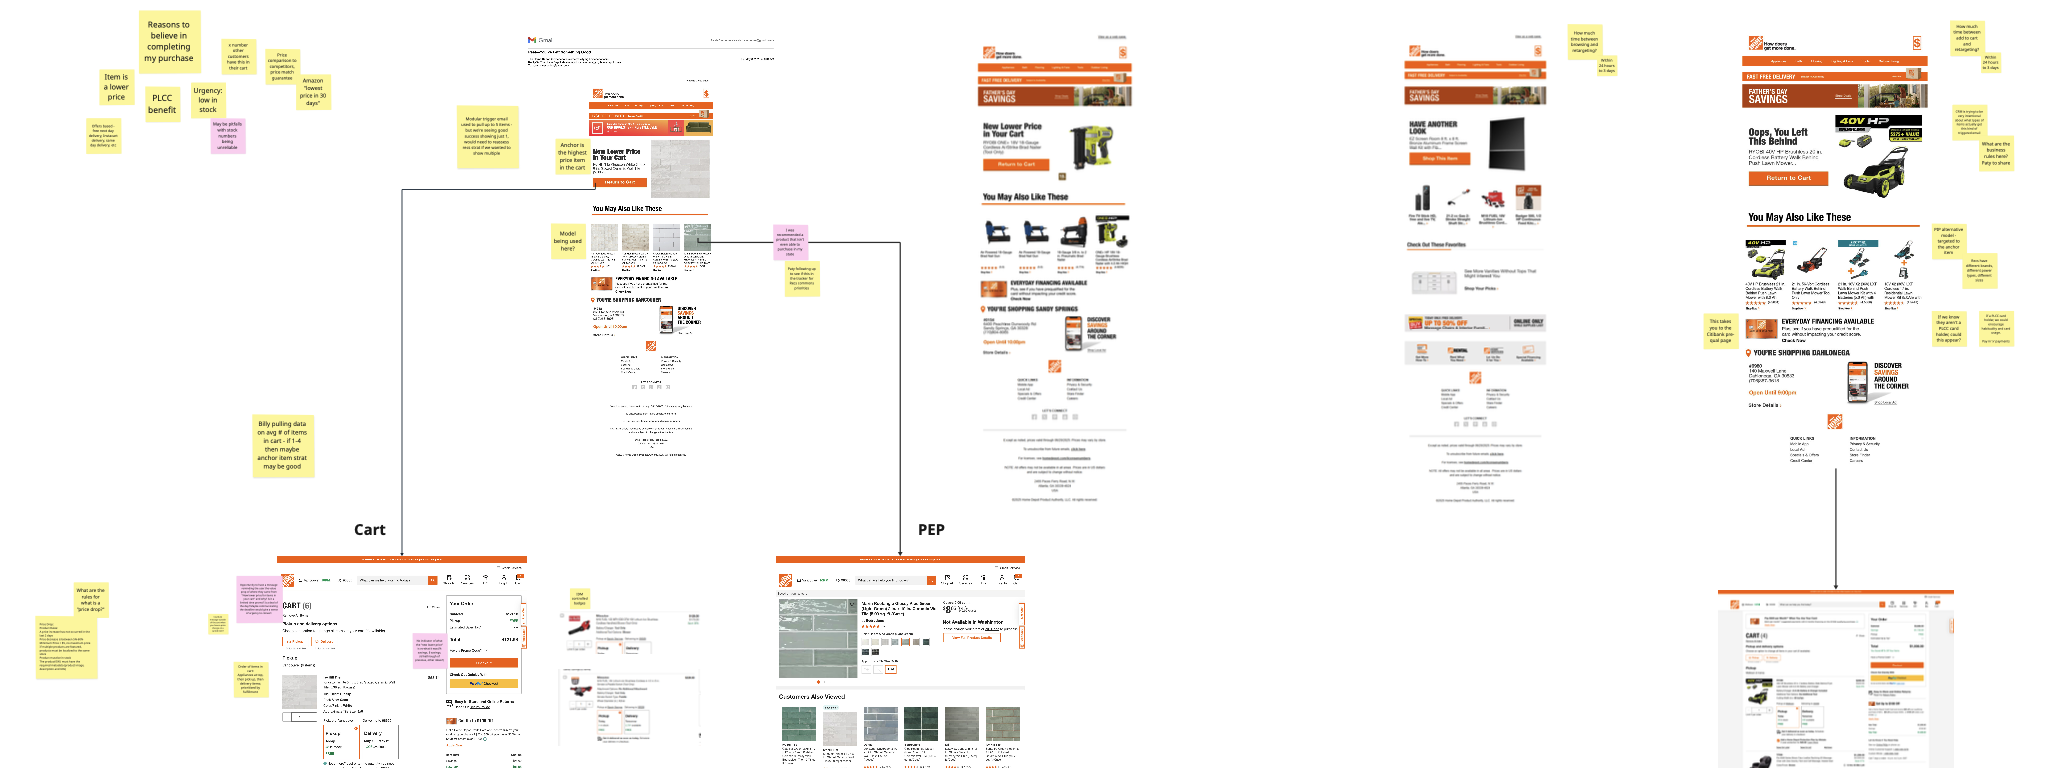
We identified 5 key journeys with ample opportunities to improve this connection:
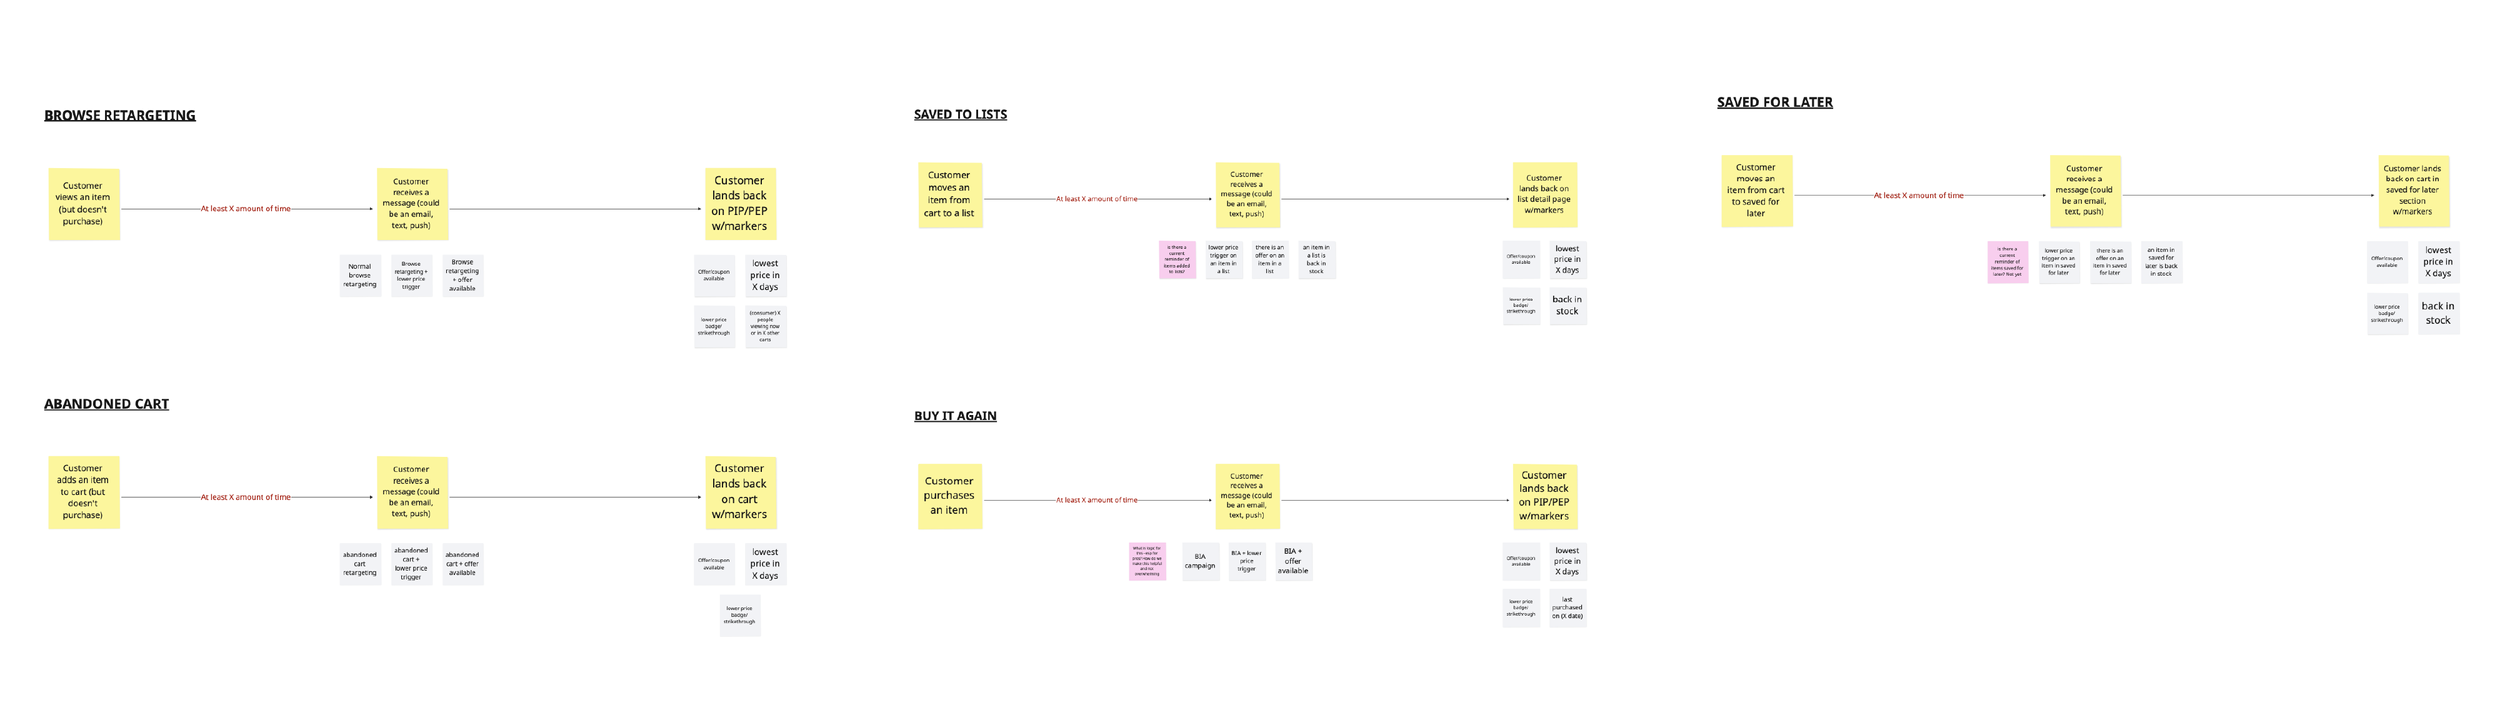
To ensure customer interest in one of the opportunities we identified, we chose to improve just the email sent as one part of the journey. We chose the abandoned cart email and improved 2 key aspects:
The intelligence behind which item(s) from the customer’s cart we chose to message them about
We added additional messaging when items in a customer’s cart also had a price drop – giving them a great reason to return and complete their purchase
Improving just this one email has brought in over $17 million in realized incremental revenue (Feb-Oct 2025).
Dynamic Content
To deliver Personalization at scale, we had to centralize our understanding of the customer, develop the intelligence to be able to consider and respond to all of their actions, and then we had to figure out what to deliver to that customer. Current processes for developing or collecting creative assets (imagery and written content), product recommendations, offers and promotions, paid media, etc. all had separate processes with incredibly different timelines – some even started up to 33 weeks in advance of a campaign.
Current processes also supported a high degree of creative control, but due to the bandwidth of creative resources, we had very limited versions to be able to deliver to a customer. Hardly anything felt unique, and we couldn’t actually deliver any personalized content.
We needed a much larger bank of content to achieve more one to many and one to few personalization, but we could only achieve fully one to one personalization with more dynamic content capabilities.
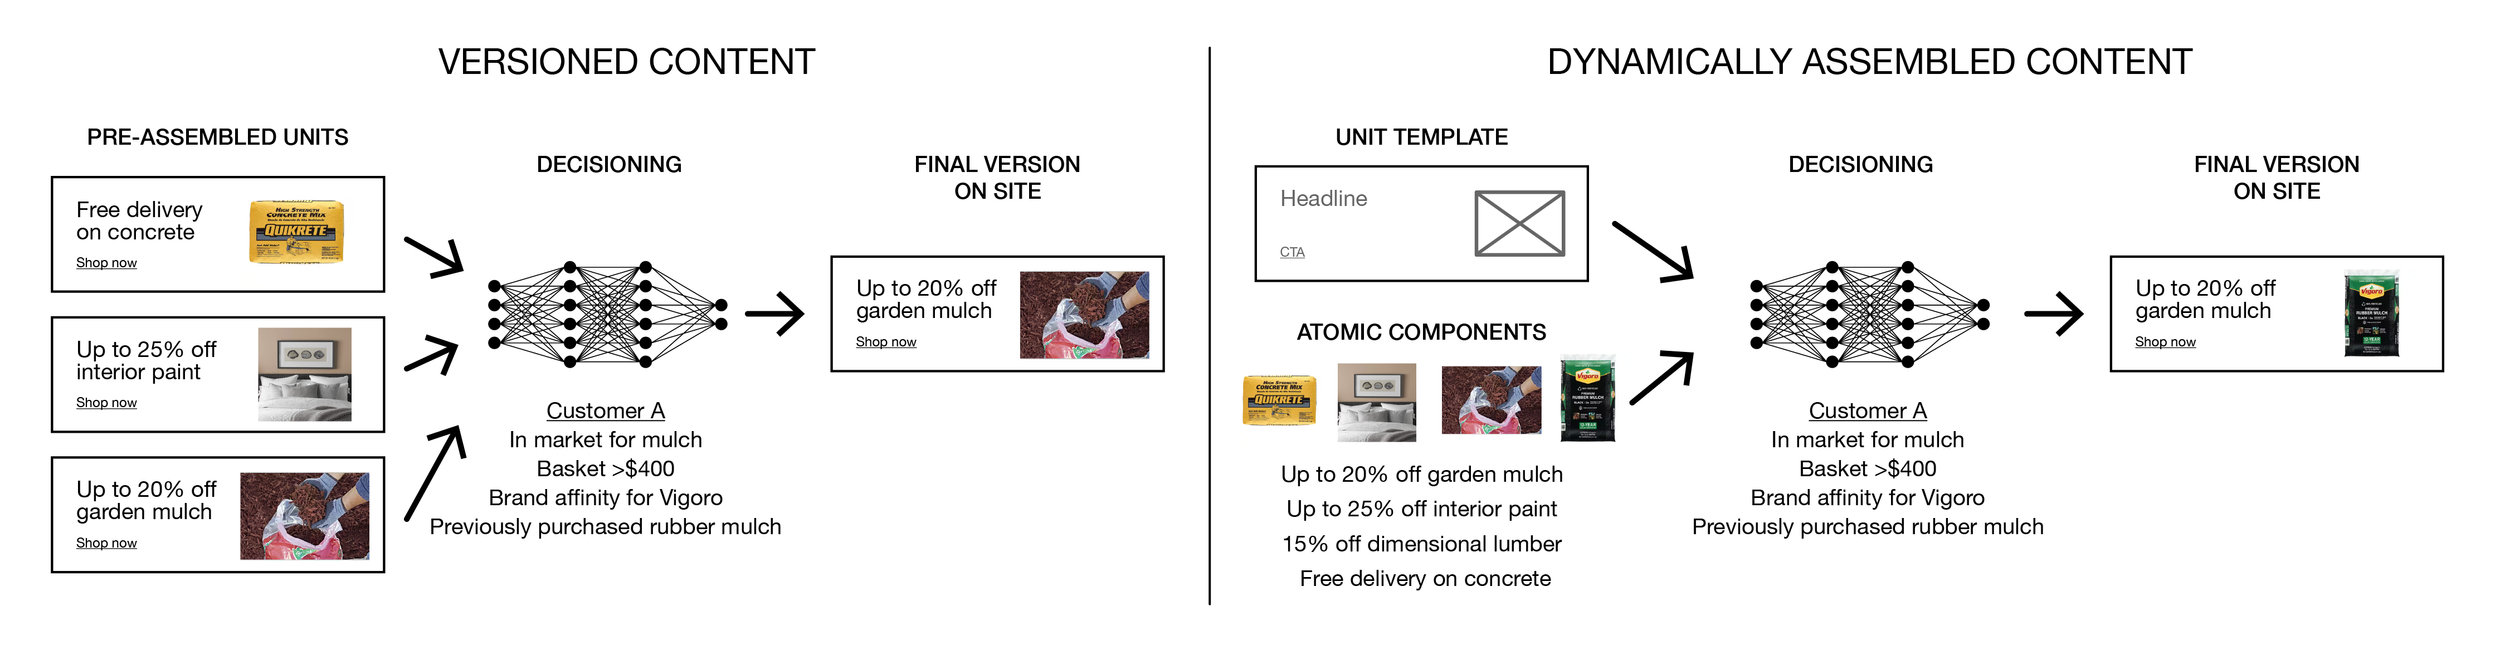
Through 2 small tests in 2024 and 2025, pre-assembled versioned content drove over $3 million in incremental revenue, and scaling to dynamically assembled content would increase relevancy and drive additional incremental revenue.
Orchestration
Even after driving alignment of our customer data and continuing to lead conversations on centralizing our intelligence and dynamic content, we still found that teams were working in cross purposes. So with my product partner we led interviews with 20+ teams to try to understand several things:
How different teams plan
What tools they use to complete their work
What other teams they work and coordinate with
What their thoughts are on the concept of orchestration
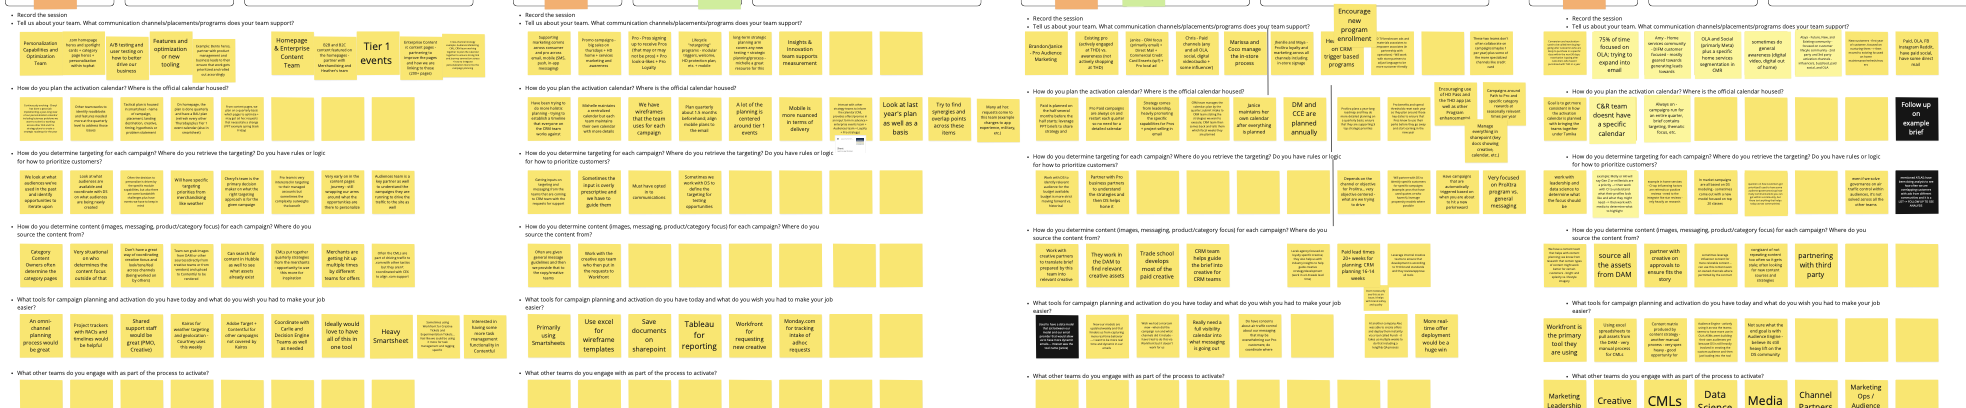
We found that there are many duplicated efforts, manual processes, and inconsistent and inadequate tools across teams. It is a herculean effort to coordinate and plan across teams and to understand the meaningful impact of that work. Whether folks are "too busy" or simply prefer to stay locked into their own processes, as a business we had not yet created or implemented any durable, long-term tools, solutions or processes that will solve for orchestration between our teams.
Our assessment found challenges and key opportunities across the business to better align our people/resources, processes, and technology.
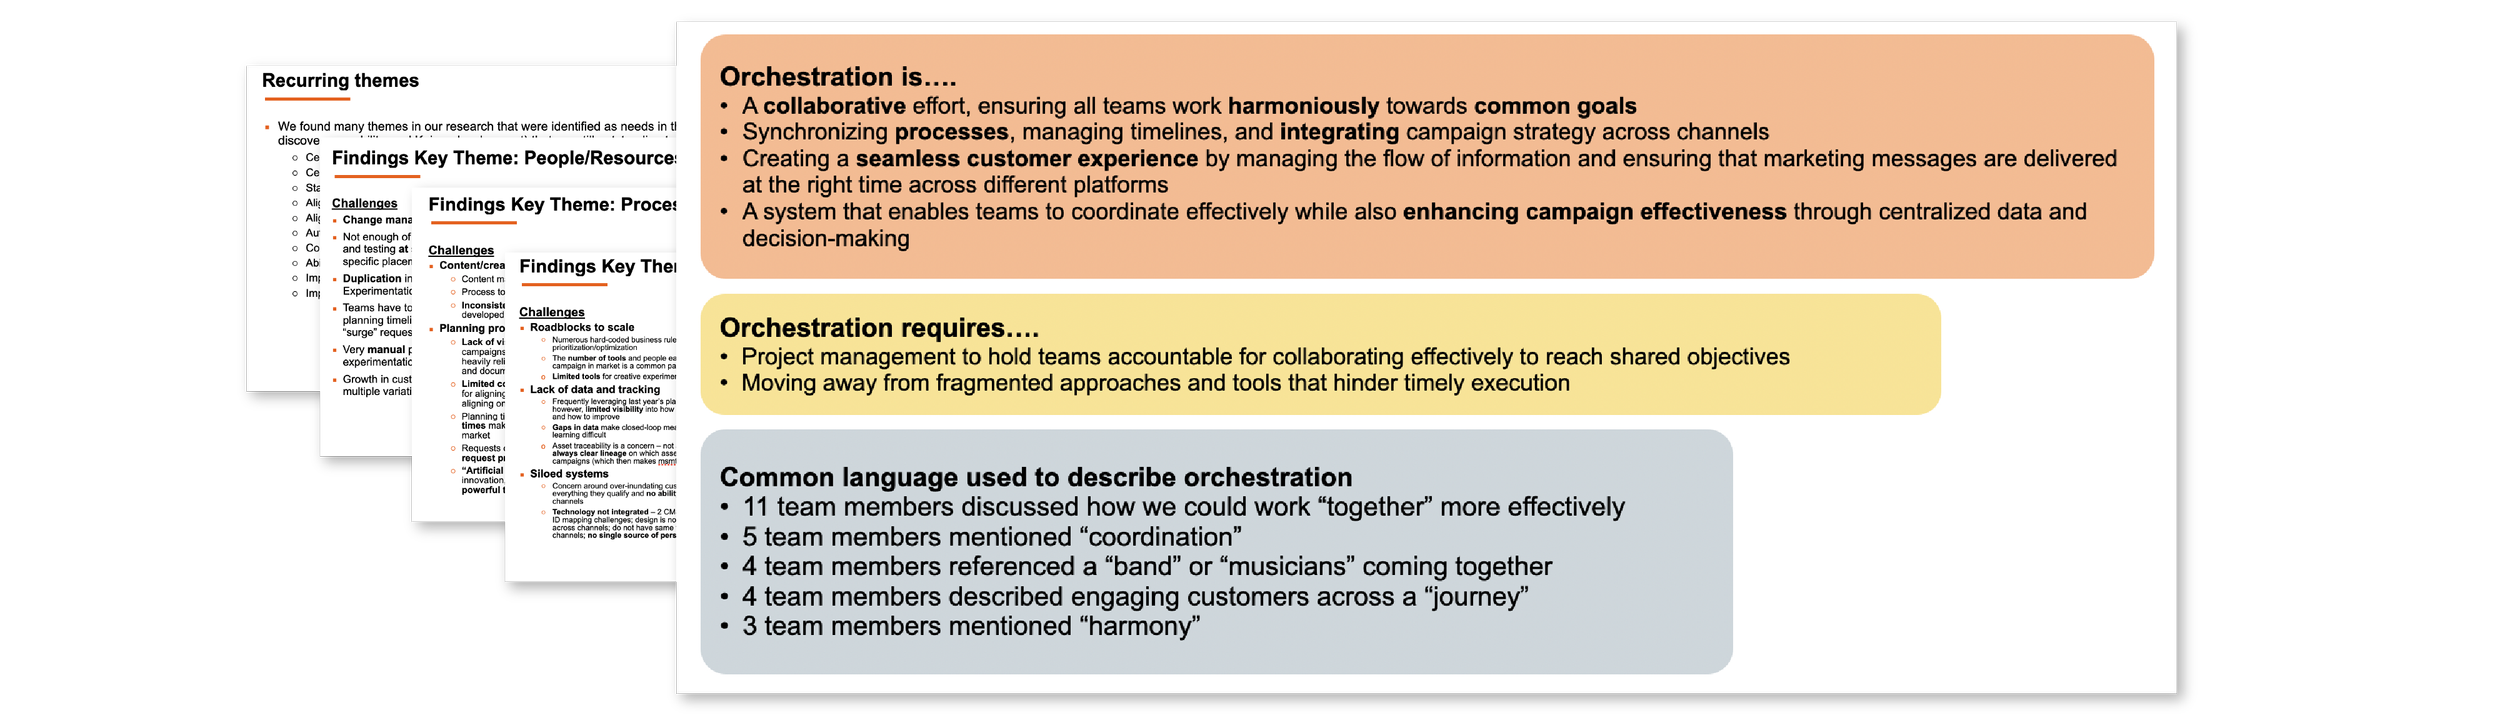
We did this assessment prior to our CDP vendor selection. After leaders selected a vendor for our CDP, we pivoted our efforts from planning another vendor evaluation to assessing how a compatible journey orchestration tool might meet our enterprise needs.
Programs Used
Design and Prototyping: Figma
Analytics and Reporting: Adobe Analytics, Quantum Metric, Tableau
Collaboration and Documentation: Jira, Confluence, Miro, Smartsheet
Presentation: PowerPoint, Keynote
Generative AI and Vibe Coding: Copilot, Gemini, Firefly, Claude